
September 2026 report · Current as of October 9
Charleston-area market watch
More inventory can create more homes to compare, but each area is moving differently. Here is what September’s detached-home reports show—and how to use the numbers when weighing a purchase or renovation.
Source: Charleston Trident Association of REALTORS / Charleston Trident MLS, via ShowingTime. Source reports checked October 20, 2026.
Detached homes · September 2026
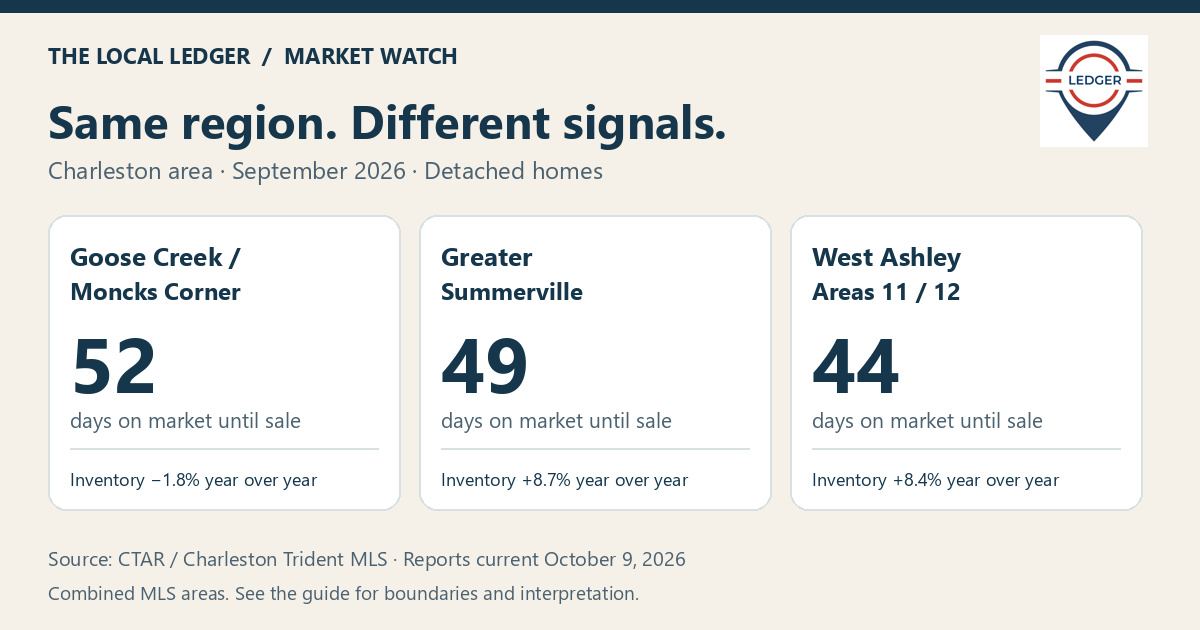
Goose Creek / Monck's Corner
MLS areas 72, 73, 74
- Closed sales
- 266
- Median sale price
- $410,000
- Days on market until sale
- 52
- Homes in inventory
- 825
- Original list price received
- 96.3%
Closings rose 10.4% from September 2025, while the median price rose 2.2%. Selling time moved from 48 to 52 days. Compare resale homes with resale homes, and builder offerings with similar new construction before reading those changes as a single trend.
Read the CTAR market reportDetached homes · September 2026
Greater Summerville Area
MLS areas 62, 63
- Closed sales
- 183
- Median sale price
- $396,150
- Days on market until sale
- 49
- Homes in inventory
- 686
- Original list price received
- 96.7%
Inventory was 8.7% higher than a year earlier, while selling time moved from 37 to 49 days. September closings were lower, even though January–September closings were up 11.1%. That makes timing and carrying-cost assumptions worth checking carefully.
Read the CTAR market reportDetached homes · September 2026
West Ashley Area
MLS areas 11, 12
- Closed sales
- 60
- Median sale price
- $539,000
- Days on market until sale
- 44
- Homes in inventory
- 233
- Original list price received
- 94.6%
Inventory rose 8.4% and September closings fell 13% year over year, while selling time improved from 53 to 44 days. Review the condition and pricing of comparable homes alongside these mixed signals.
Read the CTAR market reportWhat the figures mean
These are three combined MLS reporting areas, not individual neighborhoods. Closed sales and median prices describe September transactions; inventory is the end-of-period count. Days on Market Until Sale measures homes that sold, not how long today’s active listings have been available.
Original-list price received compares the sale price with the original asking price and excludes concessions and down-payment assistance under the report’s definition. It is not a price-cut count. Median prices can move when the mix of homes sold changes, even without the same home gaining or losing value.
Before buying a home to renovate or resell
Stress-test renovation, holding costs and resale assumptions
Comparing life around Summerville? Join the Nexton, Cane Bay & Carnes local group for that community’s conversations.
- Match the comparable sales. Compare nearby properties with similar size, condition, age and property type. Separate renovated homes from unrenovated homes and new construction; check the work and permits behind the finish photos.
- Price the full holding period. Include financing, taxes, insurance, utilities, maintenance, HOA costs and a reserve for a longer renovation or sale. A reported 44 or 52 days is not your project’s complete timeline.
- Test the exit price after costs. Add the purchase, repair budget, contingency, buying and selling costs before estimating a margin. Use supported comparable sales rather than assumed appreciation.
For a purchase, compare the complete payment and repair needs of the actual home. For an investment, review the property, financing terms and downside costs together.
Ask Matt about an investment-property financing question · Review a construction or build plan